Monday, September 06, 2010

How to create a predictive search prototype in Axure

Axure is a great application to use when mocking up interaction design concepts for usability testing. I have recently used it to simulate the interaction and display of  predictive search results activated when a user enters a specific keyword query into the search textfield. The following is a step-by-step tutorial for mocking-up an interactive "predictive search" prototype using Axure. It assumes a basic familiarity with the Axure application interface.

1. Set up your workspace- After opening the application, make sure that the "widget" panel (upper-left), the "masters" panel (lower-left), the "annotations & interactions" panel (upper-right), and the "dynamic panel manager" are all visible in your Axure workspace.


If any of the four panels above are hidden, open the "View" sub-menu from the application main menu and make sure each of the panels are checked in the menu.


2. Add a "New Master" - Create a new master by clicking on the "Add Master" icon in the "Masters" panel (lower-left). Double-click the label of the newly created master, called "New Master 1," to open the "New Master 1" tab in the "Wireframe Pane."


3. Create the search interface - (In the "New Master" tab) Drag the "Text Field" and "Button" widgets into the "Wireframe Pane".


4. Label the interface elements - Select the text field and give it a label in the "Annotations & Interactions" panel (upper-right). A label such as "search_textfield" will do nicely.


Select and label the search button. I labeled mine "search_button."


5. Add a "dynamic panel" - Drag the dynamic panel widget from the "Widgets" panel to the "Wireframe Pane." Re-size and place the panel underneath the search text field.


Set the dynamic panel to "hidden" by right-clicking the mouse while the panel is selected in the main
wireframe panel.


The dynamic panel, once set to "hidden," will appear yellow.


6. Label the dynamic panel - While the yellow dynamic panel is selected, give it a label in the "annotations & interactions" panel (as you did for the search textfield and button). I called mine, "predictive_layer."


7. Create the predictive search drop-down layer - Double-clicking the yellow, dynamic layer, will produce the "Dynamic Panel State Manager" dialogue box. You'll need to create a state for each predictive search result you want to mock-up. By default, one state already exists in the dialogue box. That state is labeled, "State 1." Although you'll probably want to change that label at some point, let's continue.


To create a mock predictive search layer that displays when a user types a specific string of characters, make sure that the panel state, "State 1," is selected. Next, click the "edit state" button on the right. You'll end-up viewing the workspace within a tab labeled, "State 1."


8. Mock-up the first predictive search result - You can visually style your search result drop-down menu however you want to (as long as it is contained within the blue guidelines in the "State 1" tab. For speed's sake, drag a white rectangle widget and a "text panel" widget from the "Widgets" panel into the "wireframe pane (center stage)." Make sure both widgets sit within the blue guidelines, which represent the viewable area that of the search drop-down layer. In addition, make sure the text panel sits on top of the white rectangle. Edit the text of the text panel to represent the predictive search results that you want displayed in reaction to a specific query. My scenario has to do with music, so I have created a drop-down list of musical artists that will display when the user types the search term "green."


9. Create the interaction that will trigger the predictive drop-down layer - Select the "New Master 1" tab in the center "Wireframe Panel," so that you can attach a behavior to the search text field. Select the text field and double-click on the "On KeyUp" interaction in the "Annotations & Interactions" panel. A dialogue box labeled, "Interaction Case Properties" will appear.


In the "Step 2. Select an Action" list that is displayed within the "Interaction Case Properties" dialogue box, select the "Show Panel" action. Next, select the blue hyperlink labeled, "Show Panel" in the "Step 3 - Edit the Actions" panel below.


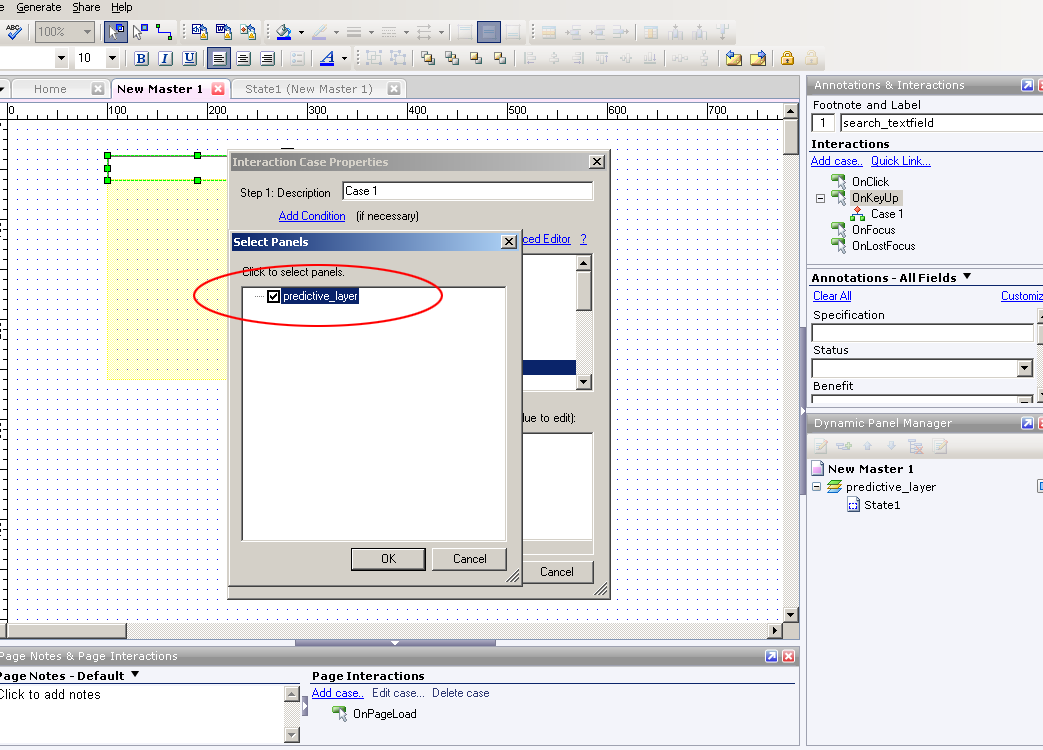
Clicking "Show Panel," will produce a second dialogue box prompting you to select the panel to display. Since only one panel was created, select the "predictive_layer" panel from within the dialogue box. Click the "Ok" button.


The second dialogue box will disappear and the 1st dialogue box will remain visible. Next, you'll need to create the condition that will produce the "predictive_layer." Do so by selecting the "Add Condition" hyperlink at the top of this dialogue box.


The dialogue box that appears when you select the "Add Condition" hyperlink above, is labeled the
"Condition Builder." In it, you'll need to make sure that the series of drop-down menus have the following values selected:

1. Satisfy "All" conditions (1st drop-down menu)
2. "text on widget" (2nd drop-down menu)
3. "search_textfield" (3rd drop-down menu)
4. "equals" (4th drop-down menu)
5. "value" (5th drop-down menu)
6. Next, type the word "green" in the text field adjacent to the 5th drop-down menu

All selections, if made correctly, will look like the following screen shot. When finished, click the "Ok" button.


The "Condition Builder" dialogue box will disappear. Finally, click the "Ok" button on the "Interaction Case Properties" dialogue box. You are now ready to test your first predictive search result.

10. Apply "Master 1" to all pages -If you are planning to mock-up multiple pages that contain the search interface, you must apply the master that contains the search interface ("Master 1") to those pages. Do so by right-clicking on the "Master 1" label in the "Masters" panel (lower-left), and then selecting "Add to Pages" in the resulting menu.


The resulting dialogue box will prompt you to select the pages in your Axure prototype to which you want "Master 1" applied. Select as many of the pages as you want. For the purpose of this demo, I selected all pages (using the "Check All" button on the right). For testing purposes, make sure you at least select the "home" page. When you are finished, click the "Ok" button.


11. Generate a prototype to test your 1st predictive search interaction - Generate a prototype by selecting "Generate" from the main application menu (top) and then selecting "prototype" from the resulting sub-menu.


The resulting dialogue box will require you to select a destination for the prototype on your hard drive.


Once you have selected a destination on your hard drive for the prototype, finish by clicking the "Generate" button on the bottom of the dialogue box. Your prototype should open in your computer's default browser. You'll see two frames (columns). The left frame contains a tree-navigation/hierarchy of the pages in your Axure project. Clicking any of the links will enable you to navigate to each page in your prototype. The center frame contains your search interface. By default, you'll start from the "Home" page.

12. Enter the search term "green" to test your prototype - To test the first predictive search layer, simply type the word "green" into the search textfield. If you have followed all of the instructions correctly, your drop-down menu should appear beneath the search interface as shown below.

Hopefully, your layer activated after typing the word "green" into the search box. To mock-up another predictive search use case, return to the Axure application window. Make sure you are working in the "New Master" tab. Double-click on the yellow, dynamic panel labeled "predictive_layer" to produce the "Dynamic Panel State Manager" dialogue box. You'll need to create an additional state for a second predictive search result that you want to mock-up. You'll see "State 1" in the list. To create another state, type a name for the new state in the textfield that is labeled "Add a new state." Now, click the button labeled "Add." I named my new state, "State 2."


After clicking the "Add" button, you'll notice a second state, "State 2" has been added to the "Panel State" list.


Double-click on the newly created "State 2" to open up a tab that has the same label. You will now create the design of the second search result layer.

13. Mock-up the second predictive search result - Again, you can visually style your search result drop-down menu however you want to (as long as it is contained within the blue guidelines in the "State 1" tab. For speed's sake, drag a white rectangle widget and a "text panel" widget from the "Widgets" panel into the "wireframe pane (center stage)." Make sure both widgets sit within the blue guidelines, which represent the viewable area that of the search drop-down layer. In addition, make sure the text panel sits on top of the white rectangle. Edit the text of the text panel to represent the predictive search results that you want displayed in reaction to a specific query. My second drop-down menu is a list of musical artists that will display when the user types the search term "red."


14. Create the interaction that will trigger the second predictive drop-down layer - Select the "New Master 1" tab in the center "Wireframe Panel," so that you can modify the behavior attached to the search text field. Select the text field and double-click on the "On KeyUp" interaction in the "Annotations & Interactions" panel. The dialogue box labeled, "Interaction Case Properties" will appear. Make sure the "Step 1 - Description" textfield reads "Case 2."  Next, look for, and select the checkbox with the label,  "Show Panel(s)." Once selected, be sure to click the blue, "Show Predictive Layer," link in Step 2.


Double-check to see if the "Predictive_Layer" is selected and click "Ok" in the dialogue box that pops up.


Next, you'll want to click the link that is labeled, "Add Condition."


The dialogue box that appears when you select the "Add Condition" hyperlink above, is labeled the
"Condition Builder." In it, you'll need to make sure that the series of drop-down menus have the following values selected:

1. Satisfy "All" conditions (1st drop-down menu)
2. "text on widget" (2nd drop-down menu)
3. "search_textfield" (3rd drop-down menu)
4. "equals" (4th drop-down menu)
5. "value" (5th drop-down menu)
6. Next, type the word "red" in the text field adjacent to the 5th drop-down menu

All selections, if made correctly, will look like the following screen shot. When finished, click the "Ok" button.


The "Condition Builder" dialogue box will disappear. Before exiting the "Interaction Case Properties" dialogue box, be sure to select the checkbox named "Set Panel State to State" above the already selected checkbox named "Show Panel." You'll need to click the blue link entitled "Set panel state to state" in the Step 3 panel.


In the resulting dialogue box, make sure that "set panel state to state" is selected in Step 1. Next, click the blue link entitled, "State 1."


Another dialogue box will appear. You'll need to select "State 2," because you want a user's search for "red" to show the "predictive_layer" panel in "State 2." Click the "Ok" button. Make sure you exit out of all remaining dialogue boxes by clicking their corresponding "Ok" buttons.


15. Generate a prototype to test your 2nd predictive search interaction - Follow the same directions for testing your second search interaction. Generate a prototype by selecting "Generate" from the main application menu (top) and then selecting "prototype" from the resulting sub-menu. This time, however, type the word "Red" into the search textfield. If all goes according to plan, the result will look like the screenshot below.


Re-test your first search interaction, by typing the word "green." The search results layer for "green" should replace the "Red" layer.

You're done - Congratulations! You've successfully created a prototype for predictive search using Axure. You can follow the same directions to mock-up additional predictive search use cases.

Jonathan Lupo
@userexperience (Twitter)

Sunday, September 05, 2010

5 Tips for a Better Mobile Application

According to one 2010 study, the penetration of mobile devices in the United States is near 100%. With nearly every pre-teen and adult American carrying a mobile phone or device, it is vital for businesses to understand how to best leverage this important channel. The mobile platform, however, is still considered by some businesses to be secondary to a web site-centric, digital strategy. Luckily, creating an effective mobile strategy is no different than designing and developing an effective web site. It simply requires a plan.

1. The aim of a mobile application shouldn't be to "shrink" the web site experience - According to 2010 W3Schools statistics, 76% of all PC/Mac screen resolutions are higher than 1024 x 768. That means a contemporary web site experience can take advantage of a large screen. There are obvious design limitations for the mobile platform, however, such as limited screen real-estate (although the iPad has increased the amount of screen real-estate to work with).Since mobile device screens are significantly smaller, a mobile application must provide a fundamentally different experience than a web site. 

2. Develop a new set of behavioral personas that focus on "mobile-relevant" tasks - Research conducted with users in support of any digital initiative should seek to identify trends in behavior related to mobile devices. As mentioned above, plan to launch a fundamentally different experience on the mobile platform than on the web platform. Start by developing a new set of behavioral personas based on "mobile-relevant" tasks. These are tasks relevant to the topic of the study that are performed "on-the-go" or "on the phone." Aggregate mobile-relevant tasks from the personas to use as the basis for use cases that the application needs to accommodate. Don't seek to support additional tasks with the application that research suggests are not likely to be performed on a phone or mobile platform.

3. Create a "Swiss Army Knife" application - Since utility is the most important aspect of a mobile application, consider bundling many useful tools into one application. These tools can be indirectly related to business-specific, conversion-driving tasks, however, they MUST be directly relevant to the business topic or industry.

4. Consider the features and strengths of the target mobile platforms - When targeting a mobile platform for deployment of an application, consider the most important built-in features of the platform. For example, iPhones come equipped with GPS-compass and high-resolution cameras. Review the use cases and personas that will inform the design of the application, and identify opportunities to incorporate features that differentiate one platform from another.

5. Use conventional user interface elements for each platform - Performance and utility are the most important factors for mobile applications. Due to wide adoption, design patterns and interface conventions are starting to emerge on the most popular platforms. Don't look to reinvent interface elements or change interaction paradigms for mobile applications. Focus on providing a useful tool that supports a user's expected interaction with the brand on a mobile platform.

Thursday, September 02, 2010

Expand Your Mind by Being Wrong

The academic, process-driven, and pseudo-scientific nature of Information Architecture sometimes leads practitioners to a religious belief in proposed solutions. Although a rigorous process may lead to a set of solutions, the danger with the apparent certainty of the solutions lies in closing the door to new possibilities that exist beyond the equation. Luckily, the discipline of Information Architecture includes validation phases for conceptual frameworks, design patterns, and interactions. Validation phases of User-Centered-Design methodology give practitioners license to conduct a fair amount of exploration when developing ideas and information design.

1. A good idea can come from anywhere - Information Architects are often bombarded by tactical direction from various internal and external project team members. It can be difficult to accept ideas from various team members due to their seemingly irrelevant subject-matter-expertise and role on the team. However, it is a mistake to refuse an idea solely based on the role of the individual offering the advice. Focus on the idea, not the source of the idea. For example, a Visual Designer may have a solution to a layout challenge without having been exposed to any user research (although it is recommended that the IA provide this summary to the Designer). Be sure to consider the Designer's innate sense of balance, layout, and feel for the page. Evaluate the Designer's direction by assessing its' impact to the page's information prioritization.

2. Ideas can be improved by adding additional "creative" brains -
Crowd sourcing uses the collective brain power of a large number of individuals to generate ideas about a topic or challenge. Sometimes, the sheer number of brains focused on a single problem can generate surprising and wonderful results. Consider polling or surveying an entire Creative team with a specific challenge to access a wide-range of solutions based on each individual's unique talents and perspectives.

3. Be casual and embrace questions -
Adopt a casual attitude towards solutions that have been generated as a result of User Centered Design process. Often, a set of solutions presented convincingly as a result of a methodology can be so persuasive that a team accepts them without question. If there are no team member questions that challenge solutions, make sure to generate a comprehensive set of questions related to the Concept or Design.

4. Consider the emotional impact of a Design - Information Design can be guided by logic and precision but still not drive adoption with end-users. The Design framework constructed as a result of research insights can sometimes lead to overly complex and mundane information design. Visual Design adds the necessary drama that inspires emotional responses from users. Don't minimize the importance of the emotional element of Design in inspiring users to action.

5. Be Wrong - Emotional attachment to opinions, decisions, and Design direction is dangerous. When a Designer is emotionally invested in a solution, he/she may feel hurt when someone else's solution is chosen. "Being right" may become more important than "being open" to other perspectives. More is learned from exposure to new and unexpected ideas then religiously defending long-held beliefs. "Be wrong" occasionally, and follow another person's direction all the way through to Usability Testing. Better yet, mock-up both approaches and validate which concept is more likely to drive adoption.

Wednesday, September 01, 2010

Plan for Successful Site Search

Site search is an extremely important utility to include on information-dense web sites as well as experiences that are destinations for users with information-seeking agendas. Careful planning, as always, is required to make site search simple and useful. Unfortunately, it is often treated as an after-thought on web design projects.

1. Identify the most frequently searched terms - There are two ways to identify likely search queries on a web site. If the web site has not yet launched, seek the aid of the Google keyword tool to uncover frequently searched terms related to the topic or actual content on the web site. If the web site has launched, then take a look at the most commonly searched keywords in a typical 3 month period. This assessment will identify the highest priority searches to accommodate with the search tool as well as provide insight into the type of content which is most difficult to find on the current site.

2. Design search results templates based on "types of searches" - Having identified the most common search terms, create a spreadsheet that maps these terms to a "search type." For example, common search terms may include "phone," "contact," or "email." It is safe to assume, for these types of searches, users are looking for contact information. Create a search results template that elevates all contact information as a highlighted result or "direct hit" when triggered by a "contact-type" search query. Another example of a type of search could be a job-seeking search via keywords such as "jobs" or "careers." Create a unique search results template that elevates the latest job openings, links to submit resumes, as well as a means to inquire about available positions. Develop special design patterns and results templates for the most frequent "types of searches" only.

3. Develop a metadata specification - Metadata is information that describes a piece of content. This information can be displayed, or not, within the user experience. When planning for search, the first consideration is to identify what content attributes will be indexed and considered when returning search results. This planning is important for two reasons. It enables the Information Architect to understand how to prioritize search results that are returned, as well as how to display them on the page. An additional consideration when planning a metadata specification is to establish content relationships. Linking types of content, such as television shows and individual episodes, will enable both to be returned when a user searches for the title of a specific television show.

4. Consider predictive search functionality - Careful planning (steps 1-3) will enable the Information Architect to understand how to trigger and display a predictive search layer that is triggered automatically as users type into the search textfield. It is vital to have already identified the most likely searches and search types, prior to planning predictive search.

5. Aggregate and incorporate ways for users to access all relevant multimedia content from search results - Some web sites contain multiple content types related to a given topic. The topic "fishing," for instance, may return videos, images, and article-based content when a search is performed. A key aspect of planning and designing search results is to identify all types of content related to a given topic. It is important to describe these content relationships in the metadata specification. Providing users an easy way to access or narrow results by type of content is important when creating a best-of-breed site search.

Monday, August 30, 2010

Embrace Advertising as a Component of User Experience Design

Incorporating advertising elegantly into a digital design is a major challenge for Information Architects, Interaction Designers, and Visual Designers. Traditional advertising banners eat up valuable real-estate on key pages. Additionally, banner advertisements usually generate negative feedback from usability test participants. The manner in which an Information Architect typically plans for advertisements on client web sites is via a set of requirements from a client stakeholder or someone representing the advertising sales team. The User Interface Designer receives a set of standard advertising banner unit specifications that he/she must "design around." The project team accepts the advertising requirements as law. Why wouldn't they? The advertisements are part of the client's revenue model.

The problem lies in an oversimplified advertising model and a lack of courage to transform it into something more engaging and relevant to customers. Here are some ideas to challenge your clients and fellow team members from Design and Strategy:

1. Utilize account preferences or behavior-based data to improve the relevancy of advertisements - Business web sites usually collect and store data about users via their volunteered marketing, communication, and profile preferences as well as their on-site behavior. Depending on what success means to an advertiser on the web site, this valuable user data can help to improve the relevancy of the advertisements shown to each user. Relevant advertisements are less likely to be the cause of user frustration.

2. Enable users to improve the relevancy of advertisements themselves - One way to engage users is to have them rate the relevancy of advertisements themselves. The data collected via a simple "thumb's up" or "thumb's down" rating system, over time, has the potential to provide a rich set of user preferences. If content promotion can be influenced by user preferences, so can advertisements.

3. Change the format of advertisements - Banners have endured because they are part of an established digital revenue model. It is less effort to change this method of delivering advertisements than trying something new and innovative. Additionally, many advertising sales teams are really good at selling IAB standard advertising units. That being said, there are different methods of placing advertisements on digital experiences that could increase the level of engagement on these experiences. Work with advertisers to weave the most popular elements of advertising (the humor, the iconic characters, the products that people want, and the ideals that some consumer brands stand for) into the very fabric of the content that is being delivered on the experience. The digital medium presents opportunities for advertisers to create brand experiences (contests, games, and interactive experiences) that generate a higher level of engagement than static banners.

4. Turn advertisements into user generated content opportunities - Brand recognition and recall is increased when users spend time creating content for advertisements. Increase engagement with advertiser brands by allowing consumers to create their own video commercials, banners, and artwork. This idea can easily be made into a contest that could create a high-degree of interaction with the web site and the advertiser.

5. Make the advertising sales team a key stakeholder in the creative process - The Design team should try to include the advertising sales team in the creative process early on in the project life-cycle. The earlier ad-sales is involved, the more likely they will be open to new ideas for advertising opportunities. Treat these stakeholders with the same amount of respect as anyone else from the client's marketing or creative team. It is likely that an entrepreneurial member of the advertising sales team has been trying to get more creative with how advertisements are delivered on the web site, and is looking for the opportunity to innovate.

Sunday, August 29, 2010

5 negative perceptions about Information Architects and how to defeat them

Information Architects often struggle to stay relevant to business clients and internal project teams due to their academic approach to achieving business objectives. Way too often, Information Architecture presentations fail to resonate with internal and external stakeholders due to how methods, findings, and solutions are presented. The following represent criticisms and challenges that Information Architects encounter on a daily basis:

1. Too academic - "User Centered Design (UCD)" is a methodology that results in intuitive and usable interfaces for information retrieval and functional applications. When too much emphasis is placed on the process, however, a presentation may fail to resonate with business stakeholders. For real impact to clients, focus on connecting the dots between UCD services and the business value generated by the service. Don't over-emphasize the methodology. Keep it simple. The focus should be on the business and the end-user, not on the discipline of Information Architecture.

2. Too much focus on end-user benefits - While the goal of User Experience Architecture is to understand and service the needs of end-users, IA practitioners for business clients achieve this goal in order to successfully accomplish business objectives. This point needs to be emphasized in every presentation made to business stakeholders, or the presentation will likely fail to resonate. Make explicit the connection between satisfying end-users and achieving business objectives

3. Too rigid with methodology - Fortunately for the discipline of Information Architecture, there are many ways to put the methodology into practice. If it was an inflexible science, it would rely on a ladder of dependencies in order to be implementable. Essentially, the discipline would become more ideological than practical. Creativity is needed, when applying the User Centered Design methodology to a business initiative, to develop an affordable and valuable set of services to clients. My previous blog post describes ways to indirectly gain intelligence about clients' end-users when upfront, primary research is out of the question. There are many alternatives to expensive services that can be utilized in the name of maintaining a healthy client relationship and project timeline, without putting the end-users' needs at risk. Understand that if upfront research is not in scope, low fidelity design validation should be proposed. And if design validation gets cut, functional prototype testing should be proposed. If any flavor of usability testing gets cut, make a proposal to the client to deploy the product to a select segment or beta population to get some feedback prior to wider distribution. Most importantly, don't be inflexible. Listen to other proposals for approaching the project strategically. In fact, don't rely on your own methods. Ask for alternatives in order to better understand the realm of possibilities that exist to better inform Design.

4. Micro-managing - Information Architects get accused of micro-managing Strategy and Design simply because of the sheer amount of work that they are asked to do. IAs are responsible for informing end-user and content requirements through research, developing use cases, producing a Design concept and interaction model, as well as validating the execution of Design. Ultimately, the perception that IAs micro-manage Design is only a reflection of the visibility and authority on a project that the Information Architect's role entails. Therefore, Information Architects have a responsibility to cultivate a culture of openness and collaboration to combat this perception and to not give in to "the power trip." The simple truth of the matter is that no one individual has all of the answers. Ideas and Design improve when a group of talented Design professionals weigh-in and provide input. Struggle ceaselessly to make sure input is regularly solicited, and watch the perception of micro-management vanish. More importantly, watch the quality of the work steadily improve.

5. Constraining Visual Design - Interaction Design is held in high-regard by certain Information Architects and treated dismissively by others. I've actually heard IAs tell me that they aren't interested in doing wireframes because the "real thinking" comes from the research and conceptual user experience strategy that results from the research analysis. The problem with that sentiment is that clients want design and interaction models sooner in the lifecycle than most Visual Designers are introduced (which is, admittedly, unfortunate). IAs, therefore, need to illustrate the conceptual framework of the user experience and begin pushing the interface elements into the Design phase. Here is where good Information Architects seek the input of Visual Designers. However, that pairing isn't always possible. When collaboration is out of scope, Information Architects should be pushing the interaction design and UI patterns of the User Experience as far as they can. Designers should not feel constrained by detailed UI documentation. Detailed interaction models are possible because of the rich insights that Information Architects gain as a result of primary research. Visual Designers should appreciate the framework and information hierarchy expressed by the Interaction Designer or Information Architect, but also challenged to improve upon these ideas. It is a sign of weakness when a Visual Designer claims that he/she can't think out of the boundaries of a wireframe. Design is, by nature, constrained by business and user requirements that the wireframe illustrates. If Design was without boundaries, it would be Art.

Jonathan Lupo
@userexperience (Twitter)

Friday, August 27, 2010

5 Ways to Inform Your Design When End-User Research Isn't in the Budget

Information Architects follow a rigorous user-centered-design methodology that, ideally, begins with upfront, end-user, behavioral research. It is our job to make a business case for this type of research by clearly illustrating its ability to achieve real business benefits. Sometimes, however, clients will not pay for this upfront research. Some projects begin with trust in the expertise of the IA and Design team.

As an Information Architect, I cannot rely on my own assumptions of what is the best taxonomy and content prioritization for clients' end-users. When upfront research is out-of-the-question, I must look for other ways to make more informed assumptions. Here are 5 ways to informally gather information about end-users:

1. Analyze the most popular keywords related to the topic of your design - Thanks to Google, businesses are eager to understand how to optimize their digital content to be findable by search engines. Because Google has a paid advertisement service that is based on top keyword searches related to various businesses, they offer a free keyword tool to help businesses identify the top keyword queries related to their business. Assume that these top queries represent the highest priority information sought, and facilitate access to relevant content through your design and taxonomy.

2. Look at competitor experiences - Your client's competitors may not have "best-of-breed" digital experiences in terms of how these experiences service customers, however, major trends in taxonomy and information design represent industry conventions and design patterns that customers will be used to. General adherance to common design patterns in a given industry will provide a foundation for best practices for that industry.

3. Develop provisional personas based on previously conducted research - Prior to beginning any project, an information architect must synthesize all existing knowledge about a client's end-user. Often, this knowledge comes from previously conducted market research. The best way to absorb this knowledge, is to develop provisional personas which take existing market research and extrapolate behaviors from the research findings. These behaviors need to be accommodated by the design and taxonomy of the experience.

4. Lurk on social networks, groups, and discussion forums related to the topic of your design - A good way to conduct research is to passively observe the conversations that take place on social networks and communities that are relevant to the topic of your Design. The most vocal participants in these conversations will be individuals that have strong opinions. Designing to meet their needs will ensure that they become vocal supporters of your client's tactics.

5. Plan for design validation as part of a "test-and-learn" plan - If upfront end-user research isn't being planned for, make a strong proposal to conduct usability or design validation testing early and often in the project lifecycle. Paper and low fidelity prototyping can be tested quickly and cheaply with small groups of target end-user segments. Once design moves into development, functional prototype testing should be considered.

Tuesday, August 24, 2010

How to prepare an effective end-user research study analysis in 10 easy steps

Analyzing an end-user research study can be a daunting task. There is a mountain of data collected and the researcher may not know how to begin organizing his/her findings. The following is a solid presentation framework that should help bring order to the chaos:

1. Restate project objectives - Every project-specific deliverable which builds upon a body of knowledge to support strategic and tactical recommendations should restate core project objectives. Deliverables generated as a result of project activities should clearly and continuously illustrate how project objectives are being met.

2. Define research objectives - Project objectives are business-focused. Research objectives are typically aimed at understanding behaviors, trends, and information-seeking agendas of end-users relevant to stated project objectives. Research objectives should not be generic. They should be aimed at identifying ideal end-user behaviors that would likely achieve project objectives.

3. Summarize key findings from previous research studies - Prior to spending a client's money engaging in additional research, the researcher should seek to understand and summarize relevant research studies that have already been conducted. Identify gaps in existing knowledge about the end-user segments, and illustrate how the current research completes the total portrait of the end-user.

4. Describe research methodology - It is best to assume that the client or audience for the research presentation is not an expert in behavioral research methods. Describe, in detail, how end-user segments were recruited, ways in which behavioral research differ from market research (emphasis on sample size), and the manner in which the interviews or contextual inquiry was conducted.

5. Elevate high-level research findings and trends - Trends will likely emerge from the research that cut across all end-user segments. It is best to elevate these important trends early on in the discussion. Additionally, it is best to introduce early recommendations to set the expectation that each finding in the research presentation will be accompanied by actionable recommendations. EVERY finding should be actionable. Clients need to understand the value of end-user research and IA researchers are responsible for emphasizing the business value that is an outcome of this type of research study.

6. Introduce behavioral personas that emerged as a result of the research - After high-level findings are discussed, the researcher can introduce the personas that were formed based on the major differences in behavioral trends observed. Discuss the behaviors that divided the personas first, then introduce each persona. When introducing each persona, be sure to include a fictitious name, photo, description, motivations, relevant key tasks, and barriers to completing key tasks. Support major persona traits with actual video clips, photographs, and end-user quotes from the research. Key tasks are better presented visually, as task flows, rather than as a list of bullets.

7. Aggregate key tasks from personas into an end-user mental model - A mental model is an important first step in designing an intuitive information architecture that facilitates the completion of key, end-user tasks. The researcher has already identified the key tasks from each persona. It is a simple matter to group these together and assess gaps in existing content needed to support each key task.

8. Develop a list of recommendations to fill gaps in content - Begin to tackle each gap illustrated in the mental model by suggesting a tactic or recommendation for content that would satisfy key end-user tasks.

9. Assign level of effort (L.O.E.), value to the business, and value to the end-user to each tactical recommendation - Documenting recommendations gives the client a vision of the overall solution. Assessing level of effort and value of each tactic helps the client prioritize each component of the solution and put tactics on a road map for implementation.

10. Define next steps - This presentation is a component of a larger set of activities that is meant to accomplish specific project objectives. Conclude the research presentation by connecting the research to its impact on project objectives as well as introducing the next activity in the project plan.

Monday, August 23, 2010

A quick look at 5 end-user research techniques

1. Contextual Inquiry

Summary - Contextual inquiry is an ethnographic research technique that involves the facilitator observing and interviewing participants in a setting where the participant naturally performs relevant behaviors to the subject of the research. Contextual inquiry is best utilized to uncover behaviors and information seeking agendas prior to designing a system, application, or interface.

Pros - Participants feel more at ease when performing relevant tasks. Task recall is easier in the context of the surroundings where relevant tasks naturally occur. The researcher is able to observe environmental factors, constraints, and technologies used. The researcher is also able to observe actual documents and information that is kept close at-hand, when actions and behaviors are performed.

Cons - Travel is sometimes required to interview locations, and this may be expensive. Additionally, unexpected environmental issues may prevent the optimal recording of audio or video. Contextual inquiry can also be dangerous, especially when participants are recruited from Craigslist. There is some risk associated with this type of field research. Don't perform this research by yourself. Always travel in pairs!

2. Lab-Based Usability Testing

Summary - Usability testing is an analysis or validation of a design in which success or failure is measured according to how easy it is for participants to perform key tasks using the design. Designs can be low fidelity (e.g. - a wireframe) or high-fidelity (a visual design comp) and testing can be performed on paper, on electronic files, or on functional prototypes.

Pros - The laboratory provides a measure of control in which unexpected changes in the environment and the testing equipment can be eliminated or minimized.

Cons -If the usability test includes a computer, there will always be differences in the set-up of the lab-based computer and the user's own computer. Additionally, the laboratory may be an unsettling environment for the participant. In general, participants feel more at ease in their own homes or places of work, as well as using their own computers.

3. Focus Groups

Summary - Focus groups are interviews with a group of participants in a laboratory-based setting (or a conference room). In a focus group, attitudes and perceptions of a group of people can be collected during the course of a moderated discussion.

Pros - A focus group allows a larger number of opinions to be collected at one time vs. 1-on-1 interviews with participants. This type of research may be more convenient for clients to observe. Focus groups are great for brainstorming ideas because individuals within the group tend to feed off of the ideas of other individuals in the group.

Cons - Focus groups are not great for understanding end-user behavior. Group dynamics play a role in the responses of each individual in the focus group. There will generally be one or more vocal participants who will influence the responses of the other participants in the room. The reverse may also be true. Some participants may rarely speak at all. Therefore, it is difficult to obtain the same level of unbiased information from each individual in the group.

4. Surveys

Summary - Surveys are used to collect feedback from a large number of respondents. Surveys may consist of closed or open-ended questions, or they may be a mixture of both.

Pros - Surveys are an ideal research tactic when a statistically significant number of responses to specific questions are needed. They can be deployed via email or from a 3rd party, hosted platform. Survey tools are generally inexpensive and generally include reporting and charting capabilities from collected responses.

Cons - Survey research is not moderated, so a researcher has no opportunity to probe responses to questions with follow-up questions. Additionally, although closed-ended responses are easier to generate reports from, they are limited in the richness of data that open-ended responses provide. A researcher learns only what the limitation of the tool allows him or her to learn.

5. Card Sorting

Summary - Card sorting exercises are typically, but not always, conducted as a 1-on-1 activity. The goal of a card sorting exercise is to understand end-user information organizational models. These models typically inform end-user taxonomies and information categorization schemes.

Pros - Tools exist to allow researchers to conduct a larger number of card sorting exercises online, similar to deploying a survey. The benefit of using an online card sorting tool is the ability to generate reports and quickly assess the most ideal taxonomy from analysis of all of the card sorts conducted.

Cons - Card sorting is difficult to explain to end-users. Therefore, deploying card sorting exercises without a face-to-face explanation of how to take the test properly, may result in a high-rate of abandonment. Finally, taxonomy development is a professional discipline. Taxonomists and information architects should not rely solely on untrained, end-users when constructing a logical categorization scheme for a system.

5 Steps to delivering an effective presentation

There's a client presentation scheduled for next week and your PowerPoint deck feels a little loose. Additionally, there's a 150 page wireframe deck that has to be reviewed as part of the agenda. By the way, there is no formal agenda. Is this a problem waiting to happen? Most definitely. Here are 5 steps to course-correcting this situation:

1. Identify goals for the presentation - Goals and objectives should be the starting point for any presentation. Being able to identify the most beneficial outcome of any situation is vital to understanding the road to get there. Delivering an effective and persuasive presentation absolutely requires this important first step. A good presentation is born from an understanding of its purpose. Visualize the desired outcome of the presentation, document this vision, and proceed to step number 2.

2. Identify the barriers to achieving the stated objectives - Identification and documentation of the presentation objectives will force the presenter to think about the barriers in the path to achieving these objectives.

3. Develop a narrative outline with the construct of: "objectives > challenges > solutions > measurement of solutions" for the presentation - All effective presentations do exactly the same thing. They tell an organized story that illustrates the impact of recommendations to what matters most to the business. If you've completed steps 1 and 2, you already know what story it is that you are going to tell (and have the chapters documented as well). A good narrative could begin like this:

I. Introduction - Achieve measurable business objectives by improving the User Experience on platform X.

A. Opportunity 1 - Achieve Business Objective X
1. Summary of Current Challenges
2. Strategic and Tactical Recommendations
3. Analyze the Success of Recommendations

B. Opportunity 2 - Achieve Business Objective Y
1. Summary of Current Challenges
2. Strategic and Tactical Recommendations
3. Analyze the Success of Recommendations

C. Opportunity 3 - Achieve Business Objective Z
1. Summary of Current Challenges
2. Strategic and Tactical Recommendations
3. Analyze the Success of Recommendations

D. A Prioritized Road Map to Implement Recommendations

E. Next Steps

4. Complete the presentation by not veering off of the course of the outline - Now that the narrative outline has been constructed for the presentation, create the rest of the slides that support each chapter of the outline. Use stakeholder notes and data to define business objectives and current challenges. Use internal team and user research data to define strategic and tactical recommendations. Use business defined key performance indicators and a measurement framework to define how you will measure the success of proposed recommendations.

5. Show don't tell - Each slide of the presentation should be an illustration of a concept or recommendation. Objectives, barriers, and strategic recommendations can be summarized and visualized as information graphics. Tactical recommendations related to the user experience can be visualized through personas and interaction design. Visuals have more impact and emotional appeal than text.

Saturday, August 21, 2010

5 Trends in media consumption

Within the last five years, many industries have had to evolve due to advances in technology as well as increased social connectedness. Here are 10 examples of how these changes have affected media consumption:

1. Media is increasingly less physical - Music is a perfect example of an industry where technology is constantly morphing the format and delivery of the media. Analog records gave way to cassette tapes. Cassettes moved aside for Compact Discs. Within the last five years or so, MP3 files erased the need for Compact Discs. The gaming industry is also undergoing the same changes. Physical games will slowly be replaced by digital downloads of video games from digital stores.

2. Media has become portable - Continuing with the music industry example, the reason for the constant change in the format of the media is likely due to the consumer demand for portability. The Sony Walkman introduced the concept of taking music with you. That trend has continued to evolve with mp3 players, iPods, and now, smart phones. The demand for portability has forced technology to shrink the size of media formats so that the consumer can travel with his/her media.

3. Devices are connected to the cloud - Portability underwent a dramatic shift when media playing devices were able to wirelessly connect to the cloud. Not only did physical formats become digital files (eg - CD to mp3), but digital files are now becoming obsolete as well! There is no longer a need for storage of digital files when digital media can be stored in the cloud. Streaming media has been around for years, but the prevalence of wireless access will surely bring this method of media delivery into its maturity.

4. Consumers are hyper-social - MySpace, Facebook, and Twitter have connected people and ignited conversations in unprecedented ways. With this "hyper-connectedness" comes sharing of information, recommendations, and multimedia. New applications such as Pandora, Miso, Tunerfish and GetGlue, all enable end-users to broadcast and recommend multimedia content to peers of their social graph. As devices are increasingly connected to the cloud, it is easy to see how social discovery of content will affect multimedia content consumption overall. Entertainment industries such as Music, TV, and Video Gaming are beginning to understand the importance of connecting to existing social networks to generate content recommendations to consumers.

5. Fidelity and portability are no longer mutually exclusive - A few years ago, the world was introduced to High Definition Television. Back then, HDTV existed in a world of 42 to 60 inch flat panel televisions that were anchored onto the walls of media enthusiasts' living rooms. Again, the demand for portability of media has made HD and near-HD quality viewing experiences possible on hand-held monitors. Personal viewers in the form of eyewear monitors can now deliver HD and even 3D video content while immersing the viewer in a theater-like environment, even when he/she is on an airplane.

Thursday, August 19, 2010

10 Tips for Conducting Better User Research

When considering enhancements, optimizations, or planning new content development, a business should aim to better understand the informational needs, tasks, and behaviors of its consumers across all digital channels. Here are 10 tips to keep in mind when designing a behavioral research study:

1. Recruit active information-seekers - Market research panels have databases of willing test participants that match demographic profiles, however, these participants are likely "professional test takers." When conducting research on a given subject, it is better to recruit subjects in the act of actively seeking information related to a relevant topic to the research study. This type of recruitment can be accomplished by launching a Google cost-per-click advertisement that solicits participation and is triggered when relevant keywords queries to the research topic are used. A list of customers who have opted into receiving email communications is also a great platform for recruiting participants to a research study.

2. Analyze existing consumer research - Nothing is worse than spending money on research that yields little to no useful results. Look to the marketing or the customer service department of a business to understand what is already known about target consumer segments. Identify gaps in knowledge about consumers, or seek to update outdated research.

3. Formulate hypotheses - Business stakeholders will volunteer hypotheses about their target customer segments. Secondary research may also suggest certain motivations, tasks, and behaviors. Designing a study with some informed hypotheses may help make lines of questioning more relevant from the get-go.

4. Develop a comprehensive list of questions - It is always a good policy to be over-prepared when conducting an interview. A research study is often commissioned by a client paying for the time the researcher is spending with the end-user. Think through and document every possible line-of-questioning and probing follow-up question. The study guide isn't a script but it should assist the research facilitator in case a line of questioning reaches a dead-end. The idea is to keep the subject talking about the subject and maintaining a calm and natural atmosphere.

5. Ask open-ended questions - Questions that naturally result in a "yes" or "no" response do not lend themselves to a dialogue. Ask questions that require subjects to be descriptive and engage in a conversation.

6. Do not ask participants to speculate - The goal of behavioral research is to understand and observe behavior. Asking a participant what they might do in a given situation or what they think they might want on a web site leads them to speculate on their behavior. Speculation leads to false and biased data.

7. Perform research in context - Behavior is best observed in the context of where it naturally occurs. Bring participants into a conference room only as a last resort. It is better to observe participants' natural behavior wherever they come into contact with relevant brands or perform actions relevant to brands. Empathy Lab believes better data is gathered when interviews with participants are conducted in homes, stores, and offices. Performing a study in the context of which a task is normally performed aids end-user recall of the task in question.

8. Videotape, record audio, and/or photograph participants as well as their environment - It may feel awkward for participants at first, but nothing proves a point like a video clip of participants performing relevant tasks. Use an external microphone or a video camera with great audio capture so that the audio is clear when making clips for a highlight reel. Additionally, researchers must obtain participants' consent prior to videotaping them.

9. Bring a research assistant - Facilitating a research study requires concentration and focus. The interviewer must make sure that all important lines-of-questioning are brought up in the interview, the conversation is natural, and questions are not "leading" the participant to a biased result. Therefore, the facilitator should not be the one taking notes or handling the technical equipment (such as a video camera or audio recording device).

10. Have a designer, copywriter, or strategist assist with the research - True collaboration in Design requires the Information Architect and Visual Designer to both understand and empathize with end-user needs. Rather than relay this information via presentation of findings, it is advantageous to have the collaborating partner accompany the researcher when the research is conducted. Similarly, a project may benefit from having a strategist or copywriter accompany the Information Architect in the research study. The right research partner depends on the type of project for which the research is being conducted.

Monday, August 16, 2010

How to measure the success of digital design

Art may be subjective, but there are definite objective measures for digital design. As is the case with any type of success criteria for digital tactics, goals must be set prior to measurement. Defining benchmarks and projections are paramount to evaluating success.

Success Metrics - Defining key performance indicators for a business is a most important first step in projecting the growth of the business. Success means different things to different types of businesses and across various industries. Of course, most businesses set out to make money; however, the pathway to profit isn't always a straight line. That means there are other measures to consider other than direct revenue from a digital platform. A fledgling business may consider traffic growth, repeat visits, or membership over time to be key performance indicators of success. Success may mean duration of visit or engagement with interactive content.

Video platforms - Advertising-based revenue on a broadband video platform requires video ad views. In general, on an advertising-supported digital experience, the longer users stay engaged, the more likely they are to be exposed to advertisements.

Ecommerce - Even on an ecommerce experience, not all success can be directly measured from sales. Conversion percentage from the shopping cart is an extremely important metric, and one that can be optimized through design enhancements to increase the likelihood that end-users can easily checkout their purchases. Additional measurements include average order value (the total average value of all items in the cart prior to checkout). Similar to an advertising-supported platform, however, engagement with an ecommerce platform often translates into increased sales because the longer the end-user stays engaged, the greater the likelihood that the user will make a purchase.

Qualitative Measures of Design- The success measurements above are quantitative analyses of data collected over time. Some of the most important measurements, however, are qualitative. While quantitative data can reveal what is happening on a digital platform, qualitative data can reveal why its happening. Collecting qualitative measurements of a digital design is a matter of interacting and asking questions with end-users as they experience the design itself. Moderated interviews enable facilitators to probe end-users after they make decisions and engage in specific behaviors.

Design Enhancements- The key to optimizing design for success requires an in-depth understanding of what success means, and measuring from baseline to projections over time. As outlined above, these measures should be both quantitative and qualitative to reveal the complete picture of the impact of the design to the end-user. Evaluation should be the starting point to understanding how to increase the effectiveness of design.

Friday, August 13, 2010

How to develop a social media strategy that makes sense

There are many valid reasons for a business to integrate social media into its' digital strategy. It does not make sense to do so, however, if the reason is "everyone is doing it." As with any content planned for a digital platform, research should be conducted to understand the likely and relevant social behaviors of target end-users. Additionally, the business should identify how social media advances it’s' objectives. The following describes some appropriate motivations for a business to plan for social media integration:

1. Increase Engagement on a Digital Platform with a "Hyper Social" End-User Community - If behavioral research uncovers highly social behavior in target end-user segments, it may be appropriate to incorporate tactics that enable interaction, discussion and sharing of digital content. Providing these "calls-to-action," for this type of audience, facilitate natural behaviors and tasks of a highly "socially connected" user base.

2. Provide Relevant Content Recommendations - Content recommendations are relevant on digital shopping experiences, broadband video experiences, as well as any digital experience where exploration of content is encouraged. Much effort is generally put into developing relevancy algorithms to understand what type of content is relevant for specific end-users based on their previous shopping and/or viewing patterns on the experience. In general, and there are exceptions, people get recommendations for "what to buy" and "what to watch" from their friends. Therefore, it may be easier to understand how to elevate "friends' recommendations" for these types of digital experiences rather than developing a complex, behavior-based, logic for content recommendations.

3. Reduce Friction in End-User Registration and Authentication - Digital consumers have likely created profiles with popular social networks such as Facebook. Rather than have them re-create their profiles, which could be a barrier to adoption, businesses may decide to enable end-users to link their existing profiles for the explicit purpose of making it easier for them to register or sign-in to their digital experience. Additionally, services which enable these connections sometimes provide access to stored preference data as well as the end-users' friends. The additional information about end-users, gleaned from linked social networks, may help to fill gaps in existing customer profiles.

4. Enable Viral Promotion of Digital Content - Making content portable, via RSS/XML feeds, and shareable, via email, add to Facebook, like, and tweet buttons, is the first step to increasing the likelihood that content will be promoted by "word of mouth." These tools are relatively easy to integrate into an existing digital experience, and provide a highly social end-user segment a logical "next step" after consuming digital content.

There are many other "community-oriented" tactics to explore include facilitating connections amongst end-users and providing a platform for "taste-makers" to review and recommend content, but the point is to understand what the business and end-user goals are prior to defining the right social media strategy for a specific business.

Monday, August 09, 2010

How to design for success

Too many digital initiatives are started in an effort to "stay relevant" or "keep up with what competitors are doing." While these may be goals unto themselves, there is a more stringent framework that a business should use to green-light digital initiatives, resulting in better business results. Whether the goal is to improve conversion on an eCommerce experience or to drive engagement, there should be business-driven or end-user-driven goals for any digital experience. That being said, simply having goals isn't enough. Goals should be measureable. Fortunately, given the nature of the medium, digital design can be measured.

The following is a framework to use when developing an approach to any digital initiative:

Step 1 - Define and document goals and objectives for the business. Understanding how and why an experience can be improved is essential to developing a measurement plan for any additional design or enhancements to an experience. What are the current goals for the business (online or offline)? How will enhancing the digital platform assist in achieving these business goals? Interview key business stakeholders to understand where the business is going and how the interactive medium will play a role in its future.

Step 2 - Define and document goals and objectives for customers. Customers, whether they are consumers or business users, should be at the core of any business. Understanding their needs, behavior, and frustrations is paramount in designing digital interfaces and enhancements to the digital platforms for any business. Conduct qualitative behavioral research interviews with actual end-users to get a better perspective on their needs.

Step 3 - Develop and document a methodology to measure success by understanding how the above business and customer goals translate into measurable performance indicators and optimal behaviors.

Step 4 - Plan for a successful design by "wireframing" an experience before spending time and effort in Photoshop. There are many prototyping tools such as Visio, Axure, and InDesign that enable the designer to focus on meeting business and end-user goals with their design prior to "decorating" an experience.

Step 5 - Measure first, develop and deploy, then measure again! Prior to launching an enhanced or new digital experience, conduct usability and acceptance testing on a planned design to see if it will likely meet customer needs. Revise the design if it seems like there are major usability issues. If and when major issues are solved, deploy the experience and measure it again. Post-deployment issues that are identified should be put on a road map for later enhancements.

Once a road map is constructed, it will become easier to identify WHAT to enhance. Additionally, it will become clearer that the measurement of digital initiatives against business and customer goals should be the primary driver for any future enhancements.

Saturday, July 31, 2010

How to enable social discovery of content

Consumers spend a significant amount of time online building digital profiles and feeding preference engines on web sites that promise an intelligent algorithm to understand their tastes and likely behaviors. While consumer volunteered preferences may seem highly relevant and useful as a means to offer content recommendations on digital experiences, it also seems like an overly complex way to address this simple need.

Another solution to address the consumer need of useful and relevant content lies in the old metaphor of the “office water cooler.” As a contemporary metaphor, the water cooler represents a consumer’s social network across multiple digital channels. A consumer’s social network, like the water cooler, is an oracle (rather, it is a gathering place for oracles). This metaphor, in its original meaning, suggested that a group of colleagues gather around the water cooler on Monday morning to discuss the TV shows they watched on Sunday evening. The modern translation of this concept is that a consumer’s social graph is his/her most relevant source for entertainment, recommendations, and useful information. While the water cooler scenario described a sphere of influence that was confined to the office, the success of social networks, such as Facebook, proves that a potential sphere of influence for today’s consumer includes his/her family, friends, peers, colleagues, and former classmates.

Considering the tremendous success of Facebook, it is obvious that there is great potential in leveraging a consumer’s social graph to serve relevant content and recommendations. The best application of this strategy on a digital experience is to build a platform for highly connected social networks to generate recommendations to members of the same social graph for the purpose of driving engagement. The tactic works especially well with brands that already have credibility and presence within a particular industry. Stated another way, social discovery of content is most successful on digital platforms that already have large audiences. To further drive engagement on such a platform, it is a matter of “re-tooling” it to support secondary social tasks, such as the ability to create lists and recommendations that can be shared and used by members of the same social graph, to discover new and useful content.

Peer-influenced recommendations have the potential to be more effective than recommendations generated from an algorithm based on a consumer’s own behavior. It is typically assumed that the success of consumer targeted tactics is based on relevancy to the consumer. For example, a web site may offer consumer ratings and reviews. These content recommendations may be more relevant to a consumer visiting a web site than editorially-driven ratings or reviews (given the potential for bias, based on advertising agendas). The tier of relevance described in the above scenario includes all web site visitors, and while that level of relevance may be more influential to consumers than an editor’s perspective, greater relevance may be achieved by utilizing a consumer’s own behavior (viewing content, bookmarking content, shopping, etc.) to generate recommendations. There are, however, challenges associated with the creation of a technology-driven solution to collect, understand, and utilize a consumer’s own behavior to provide more relevant content:

1. It's complicated. A significant investment is needed to build a database and relevancy algorithm that improves over time (based on the collection of consumer behavior over time).

2. It eliminates the element of surprise. For example, on an ecommerce web site, recommendations based on a consumer’s previous purchases will likely result in products that the consumer would normally seek out, via the traditional modes of search and discovery (i.e. - web site search and navigation). Relying on previous purchases and content consumed eliminates surprising discoveries that the consumer’s social sphere of influence might surface based on each peer’s unique preferences. It is a simple principle. People are friends with other people that are similar to them, but not identical. There are always members of a social sphere of influence that are taste-makers to other individuals within the same social network. That’s the primary reason a technology-driven solution that focuses on an audience of one will fail to provide the surprise and “true discovery” that a social network can provide to a consumer.

The mechanics of implementing social discovery of content on a particular digital experience may not be easy; however, there are platforms and design patterns in existence that may be leveraged. Given its popularity, Facebook connections to allow consumers to view their friends' activity relevant to the digital experience, should be considered a primary tactic. If a digital platform already has its own community, it may be a matter of extending this community to include Facebook connections, then adding social functionality to enable the larger community to create shareable lists from the content ("top 10 videos to watch on a Sunday evening," etc.).

As always, understanding what is relevant to consumers requires an in-depth understanding of their likely behaviors, motivations, and preferences. This level of understanding is obtained through customer research, and should be used as a foundation to determine what tactics will likely be successful.

Thursday, June 17, 2010

The couch potato moves closer to the monitor

My first blog post, about 4 years ago, was a reaction to the YouTube craze. I asked the question "do people really need their computers to act like televisions?" My belief was that interactivity, or "active," consumption of multimedia would ultimately win out over "passive" consumption of digital video. I thought the shift from active to passive behavior was strange, especially on an interactive platform. Four years later, people are still all over YouTube, treating their computers like TVs. The "couch potato" has moved even closer to the monitor.

Oddly, a new, hybrid trend in user behavior is emerging that is both active and passive. This trend is enabled by a concept called "TV everywhere." A moderately tech-savvy consumer now has the ability to watch TV on a laptop, iPod, iPhone, iPad, or Android phone. TV "on the go" is available to all three screens (TV, computer, mobile device). It is an active behavior because "on the go" implies the consumer is doing other things, such as travelling for business or visiting friends. It is also a "passive" behavior, however, because the consumer's free time is spent watching video content.

Essentially, TV is far from dead. The maturation of mobile technology with big and bright LCD screens has enabled us to carry our televisions with us, in our pockets. TV is an extension of our own bodies. It travels with us.

And, the reverse trend is coming too. We will soon have internet access on our televisions. It is already a reality on some TVs. How will the introduction of interactivity to an inherently "passive" platform (our TVs) change viewer behavior? Other than calling up photo galleries from Flickr and Picasa on the TV, what else will the couch potato want to do on their TVs?

Saturday, February 20, 2010

:: The answer isn't always "a web site"... especially now!

The image of your customer sitting at a computer to conduct business with you, via your web site, is rapidly becoming an antiquated notion. While it is a given, that to be successful your website must anticipate and reliably facilitate key end-user task completion, it is a sure bet that your audience is looking for your services across multiple, digital channels (iPhone, iPad, iPod Touch, PS3, their TV, whatever is "connected to the cloud"). In fact, you should be attempting to understand the lifestyle and behavior of your target audience in an effort to deliver your products and services the way THEY expect. The mobile channel, in the past, was considered a complement to a company's web site offering. Now, the mobile platform may be the first point of interaction that customers have with your brand.

The key concept to grasp is that your content can be delivered via the internet to a variety of widely available and utilized platforms. The internet no longer equals a collection of web sites. Almost any appliance or electronic device, these days, is "connected to the cloud." It is a simple matter of understanding the context in which your services might be consumed across these cloud-based service platforms. First, you need to ask, which platforms are widely utilized by my target audience? Next, you'll investigate the trends in usage patterns. What are your end-users doing on their iPhones? Are they utilizing competitor services? Which competitor services? Etc. etc.

Ultimately, when planning a digital tactic, enhancement, or offering, the starting point does not always have to be your web site. The truth, as always, lies in understanding and anticipating your end-users' behavior. This understanding is the Rosetta Stone for developing and deploying successful digital tactics.

Sunday, May 03, 2009

:: Don't try to quantify qualitative responses

Nothing is more confusing than a qualitative research study that tries to incorporate quantitative measurement. Prior to conducting a usability test, for example, my client questioned why I wasn't planning to record how fast it would take my participants to complete key tasks. There are several reasons why I feel this measurement would not yield useful information:

1. In a test environment, the speed in which a user completes a task is inherently biased due to the fact that the participant knows he/she is conducting a test.

2. The time in which it takes a user to complete a task changes based on the user's familiarity with the system or website. Therefore, "time to task completion" will decrease as the user gains familiarity with the website.

3. (most importantly) I am interested in the participant's "qualitative reaction" when completing the task. I am listening to their words and watching their facial expressions to understand how frustrating the experience is. Finally, I am looking for trends in behavior, rather than trying to quantify participants' speed to task completion.

Qualitative research is meant to uncover trends in behavior, which will yield rich insights to inform interaction design. Behavioral research is conducted with limited numbers of participants, so the data uncovered in this type of research is difficult to quantify. Quantifying behavior (e.g. - "calculating time to task completion") is less informative to design than identifying common behaviors and negative behaviors, anyway.